Does Winning Matter?


Another version of this article, in a more academic layout, will be submitted to a journal of research that is to be determined. Link to our Github.
Fans and front offices alike have long questioned whether winning at the minor league level has any effect on a player’s career and have failed to come to a consensus. Some say that winning in the minors is just for pride’s sake and causes no tangible change. Others insist that winning is enormously important.
Josh Norris explored this very topic a little more than a year ago and heard some really intriguing feedback.
We polled several front office members for their thoughts and received answers ranging from “no significant impact” to “winning definitely matters”. Yet despite the disagreement, one thing everyone mentioned was that the role of the minor leagues is a tricky balance between player development and winning.
A baseball operations analyst with an AL team said: “You’ll get a lot of different answers. I think that it does (matter), especially at the higher levels. The difficulty is, a lot of successful Double-A or Triple-A teams aren’t always prospect laden. A lot of Quad-A types populate winning high-minors clubs. So not over-prioritizing winning at the expense of having youth at those levels, even if they struggle a little, is the balance.”
With no clear resolution, we set out to quantify how much winning in the minor leagues matters to a player’s development.
Model Creation
In order to judge a player’s career, we used two different measures of success. The first was a player’s chances of making the major leagues. The second was the sum of their WAR in their first six seasons, as measured by FanGraphs. We chose six-year fWAR because it most accurately represents the period of time where an organization controls the rights to a player—a necessary cutoff before free agency. Once a player is exposed to the open market and distances themselves from their parent club’s development process, their minor league performance means notably less.
As for the independent variables (i.e. what could predict a successful career), the most important component to this analysis is a player’s winning percentage throughout their minor league career. That is, how many games did a player’s team win and lose while they were on the roster?
Now, wins and losses aren’t regularly recorded statistics for minor league players, so we had to combine multiple sources of data to replicate what’s missing.
For example, a player who spent their entire 2017 season on the West Michigan Whitecaps, owner of the highest winning percentage among all full-season affiliates. That player would have won 91 games and lost 45 games. And a player who spent their entire season on the Lake County Captains would have won 54 games and lost 85 games.
However, it isn’t common for players to spend their entire season at the same level or for the same organization. So, we had to merge multiple stints on different teams and over several years into a career’s worth of win-loss data. Matching each stint’s beginning and end dates with the team’s record during that time led to a full win-loss history. In theory, this sounds simple enough but there are always bumps in the road when dealing with minor league baseball data.
Minor league game logs were only available on MiLB.com from the 2005 season on, so we excluded every player whose career began prior. Similarly, we needed at least a 6-year sample of WAR from each graduated player, so we set the minor-league cut-off season at 2012.
We didn’t want incomplete career records potentially biasing our player sample.
Moreover, not every team’s game logs are still available online. Many teams that relocated and changed names sometime between 2005 and the present day didn’t have an online presence, and such, lacked game logs (like how the Vero Beach Devil Rays moved and became the Charlotte Stone Crabs). However, teams that only switched names but continued operations as the same location-entity still had their logs available (like how the West Tennessee Diamond Jaxx became the Jackson Generals).
After assembling every sampled minor leaguer’s career win-loss record, we needed to account for any extra playing time or possible confidence boost associated with the postseason. To do so, we collected data on the playoff teams and champions of every minor league level during our sample period.
The playoffs offer two potential benefits. The first is that playing more games simply means more practice time, and the second is that making a successful playoff push could provide previously uncountable developmental benefits.
Finally, in a model like this, one needs to control for elements that might be hidden and lead to faulty results. As a result, we had to account for the confounding nature of prospect status. Being a highly-renowned prospect should theoretically lead to a higher chance of reaching the majors and a higher share of WAR once there. At the same time, it also likely leads to better performances while in the minors. Therefore, we needed to control for this outside influence; otherwise it could cloud how important winning truly is.
Think about it this way–Mike Trout was a highly touted prospect who likely would’ve been a great player no matter how many games his team won when in the minors. And given his extraordinary talent, it’s probable that his team would have ended up winning a relatively large proportion of games anyway. Since the goal of this analysis is to isolate how much winning matters, creating a variable that controls for the quality of a prospect helps untangle the long-term effects of winning.
Methodology
To get every game log, we built a Python script to scrape each team’s schedule on MiLB.com. For each team season, we collected the date, score, and result of every game.
Now, since we previously mentioned that players rarely spend all of their season on one team and often jump around from level to level, we had to find start and end dates for every stint. Luckily, Baseball Reference has exactly when a player joins and leaves a roster listed on each player’s page, even at the minor league level. Check out Bo Bichette’s page for example. With those dates in mind, we scraped Baseball Reference for the stints of every minor leaguer who played between 2005 and 2012 (as the aforementioned bookends of our sample).
We matched both of those datasets together to acquire the win-loss records that correspond to each player stint. We decided to split each of these winning percentages up by level to see if winning might matter differently in the Dominican Summer League versus the Pacific Coast League, given the enormous differences in experience and talent at both levels.
After gathering the playoff and championship information for each league, we determined whether a player was a part of a playoff run based on their final day on a roster. As a general rule, we decided that a player on a roster on or after August 15th would be considered as playoff participants. We then tabulated the percentage of seasons that a player reached the playoffs and the percentage of seasons that a player won a championship.
Baseball America Prospect Methodology
We also needed to account for the talent level of the player. To do this, we analyzed the Baseball America team Top 30 prospect rankings from 2004 to 2013. Prospects ranked in 2013 (and after) were removed from the sample because we could not track their status, which delimits our sample.
Our dependent variable (i.e. what is being predicted) in this mini-study was WAR per season rather than six-year WAR because BA’s goal is to predict the most successful careers as opposed to just a player’s first six seasons.
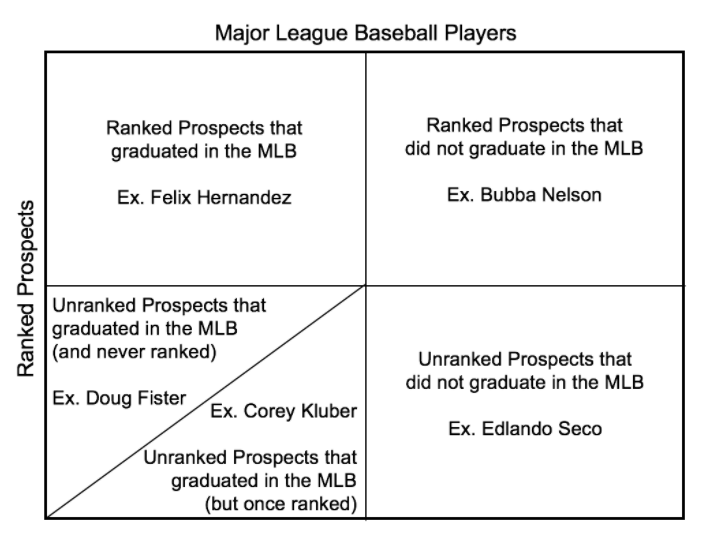
We found the average WAR per season for each prospect ranked from 1 to 30, as well as those that went unranked. We used a player’s last rank prior to graduation from rookie eligibility as the most accurate depiction of a player’s prospect status except for when a player did not graduate. In that case, their most recent ranking is used so as to not positively bias the value of ranked players. If these “once-ranked but never graduated players” were considered unranked by our methodology, all ranked players would theoretically have graduated, which would be untrue (see: Bubba Nelson). At the same time, players who were once ranked by BA, but unranked in the season prior to graduation qualified as unranked in our sample (see: Corey Kluber).
For more on the differentiation between prospects and major league service time, see this handy chart below.
As a precursor to both models, we had to figure out the correct values to use as a prospect proxy (the control against talent). If we simply plugged in a player’s rank one through thirty, the results could be skewed because we didn’t know if a number-one ranked prospect is equivalent to thirty times the value of a thirtieth-ranked prospect. In addition, we had no way of knowing the corresponding value of an unranked prospect. Are they the 31st best or maybe somewhere around 50th, relative to the top thirty rankings?
In order to find out, we calculated the average career WAR per season that a player of each rank prior to graduating accrued. Likewise, we calculated the average expectancy that a player ranked x in their last ranked season reached the major leagues. Both of these scatter plot trend lines were smoothed to account for a sample size that produced minor kinks (we couldn’t find a reasonable explanation that would purposefully cause minor fluctuations). What follows are two graphs demonstrating the general trends.
We were able to determine that being unranked is approximately equivalent to being the 42nd ranked prospect in any given organization (~41st by six-year WAR and ~44th by MLB%), which explains the placement of unranked players on the x-axis. Unranked players occasionally come along and have solid careers, but for the most part, those that are unranked prior to graduating or that never do graduate produce either null or negative value.
Similarly, being the number one ranked prospect in an organization the season prior to graduating leads to, on average, 1.63 WAR per season and graduating as the 30th ranked prospect leads to 0.06 WAR per season. The 0.06 WAR per season is not only the resulting value of all players that made the majors after being ranked 30th, but also includes those who did not make the majors as zeroes. Therefore, the value of WAR at each rank is watered down.
On the graph indicating the percentage of players who made the majors, those that were ranked number one in their organization graduated 100 percent of the time (109 of 109 in our sample), and those most recently ranked 30th made the majors just 11 percent of the time. Of the 69 players who most recently ranked 2nd in their organization, all but one made the majors (the Indians’ Chuck Lofgren in 2008).
Each consecutive rank from our analysis was less successful than its predecessor except for the tail end of the WAR per season graph. With help from J.J. Cooper, we identified the likely cause: Baseball America sometimes leans towards players with higher upside at the end of a list so as not to miss out on potential upside. If the rankers had to choose between a safer low-upside prospect and a high-upside gamble, it’s more likely they’d squeeze in the boom-or-bust type. The result is that players on the back end of lists reach the majors at slightly lower rates but produce slightly more net WAR. See the table below for the smoothed values at each rank.
| Prospect Rank | WAR per Season | % Majors |
| 1 | 1.635 | 100% |
| 2 | 1.347 | 100% |
| 3 | 1.122 | 99% |
| 4 | 0.946 | 96% |
| 5 | 0.806 | 93% |
| 6 | 0.693 | 89% |
| 7 | 0.599 | 84% |
| 8 | 0.518 | 79% |
| 9 | 0.448 | 74% |
| 10 | 0.386 | 68% |
| 11 | 0.330 | 62% |
| 12 | 0.280 | 57% |
| 13 | 0.235 | 51% |
| 14 | 0.195 | 46% |
| 15 | 0.161 | 41% |
| 16 | 0.131 | 36% |
| 17 | 0.107 | 32% |
| 18 | 0.088 | 29% |
| 19 | 0.073 | 26% |
| 20 | 0.062 | 24% |
| 21 | 0.053 | 22% |
| 22 | 0.047 | 21% |
| 23 | 0.043 | 20% |
| 24 | 0.038 | 19% |
| 25 | 0.034 | 19% |
| 26 | 0.030 | 18% |
| 27 | 0.028 | 17% |
| 28 | 0.029 | 16% |
| 29 | 0.037 | 14% |
| 30 | 0.057 | 11% |
| Unranked | 0.002 | 5% |
As for our dependent variables, we had to find the WAR a player produced during their first six seasons in the MLB. This is complicated by the fact that a lot of players don’t play six consecutive seasons. Dylan Bundy, for example, first tasted the majors for all of 1.2 innings in 2012 and didn’t resurface again until 2016. If one were to simply add six years to a player’s first moment of service time, there’d be impermissible gaps – Bundy would be considered to have reached his six full years of service at the end of the 2017 season.
To correct for this, we had to figure out when each player graduated and how many “empty” seasons they had along the way. An empty season basically means a year without entering a single game, either lost due to injury, sent back down to the minors, etc. Correcting for these service time issues creates a more accurate assessment of when a player ended their full six seasons and became a free agent, but it isn’t flawless.
Finding out if a player ever made the majors is relatively simple. If their ID ever appeared on a major-league leaderboard as either a pitcher or batter, they made it.
At this point, we had collected all of the necessary data to run both models – on six-year WAR and percent chances of reaching the majors. These regressions were then run using the R programming language on our final sample of nearly 12,000 players.
Results
Six-Year WAR
In the graph below, you can see the results of the regression on the first six seasons of WAR. The first thing that jumps out is just how massive the magnitude of the prospect proxy is, essentially proving what numerous front office officials said about the relationship between winning and development. Development and the quality of the player will always come first.
However, we found that having a higher winning percentage is beneficial to a player’s long-term forecast, especially in the upper levels of the minor leagues. In fact, both the AAA and AA winning percentages are significant at the 0.1% level (statistics talk for scientifically meaningful), and the beneficial impact of having a higher winning percentage generally increases as one ascends the minor league ladder. On average, winning ten more percentage points of games at the AAA level (from winning 45% of games to 55%) increases a player’s six-year WAR by an additional 0.11. And at the AA level, winning ten more percentage points of games increases a player’s six-year WAR by an additional 0.09.
Although statistically insignificant, the rate at which a player makes the playoffs is positive, corroborating the two possible benefits mentioned earlier. When we ran a separate regression on six-year WAR solely using playoff and championship percentages as independents, we found that reaching the playoffs was very significant and positive. Winning the championships at the minor league level was still negative and insignificant. This could mean that there is a small, positive effect that arises from making the playoffs but that winning it all does essentially nothing for a player’s development.
The graph above shows the results of the model. The intercept is where a player’s WAR would be without any influence from other variables. It makes sense that this is close to zero, because a non-prospect with no minor league experience (hence no minor league winning percentages) would likely have zero value in the major leagues.
The next set of variables in the graph pertain to each minor league level. To be able to run a model, every row (in this case, a player) needs to have a value. Because most players do not play at every minor league level, we used another variable of whether a prospect played at a level and used it as an interaction variable. By including both winning percentage at the level and if they played at the level and running it concurrently in the model, it captures the true effect of winning at a given level without sacrificing any observations.
Let’s run through an isolated example. The effect of winning at the AAA level is the winning percentage coefficient (the light red part of the graph) multiplied by the winning percentage, plus the effect of playing at the AAA level (the dark red).
When the prospect status of a player is thrown into the equation, the coefficient of 6.666 is multiplied by the prospect proxy value that corresponds to their ranking. Below is an equation that demonstrates the singular application of those three variables.
1.118(AAA Winning Percentage) – 0.184 + 6.666(Prospect Proxy Value) = Projected WAR
This equation doesn’t factor in any of the other variables, but it’s a functional example of how model application works.
Reaching the MLB
Being a highly-ranked prospect still matters the most by a large degree when it comes to reaching the MLB, but its effect is not quite as strong as in the model on six-year WAR. If you think about it, this makes sense because lesser prospects often make the majors as emergency backups but never accrue any meaningful impact.
What’s also being confirmed here is that playing in the upper levels of the minors leads to a higher chance of reaching the MLB. A player on the Rochester Red Wings stands a greater chance of being called up at any point in the future than anyone on the DSL Twins, for instance.
Similar to the previous model–having higher winning percentages in the upper levels of the minors is more beneficial to a player than in the lower levels. It is positive and significant in both AAA and AA at the 0.1% level, in High-A at the 5% level, and in Single-A at the 10% level. At the AAA level, winning ten more percentage points of games (from 45% to 55%) increases a player’s chances of reaching the majors by an additional 1.6%. And at the AA level, winning ten more percentage points of games increases a player’s chances of reaching the majors by an additional 1.8%.
At the same time, winning doesn’t really matter – as far as developmental impact goes – below the Class A level. What matters most is there experience and development.
This model’s interaction variables work in the same way as the previous model, in that a level’s net effect on making the majors is the sum of a player’s winning percentage multiplied by its coefficient plus the variable indicating their experience there.
Potential Implications
There are a couple of ways in our research could affect the front offices of Major League Baseball teams.
One such implication is that signing veteran minor league free agents to fill the upper levels of an organization’s farm is verifiably important. Even if these players never stand a chance to contribute in the majors, they contribute towards winning games in the minor leagues – and thus impact other players’ developments.
In the same vein, the draft and post-draft signings can be advantageous sources of better-equipped talent. While senior signs already function as essential bonus-saving selections, they can also be incredibly useful when it comes to production in the low minors. A polished first baseman from the SEC, for example, would theoretically help a low-minors team win more so than any raw player.
This can also play into the long-held theory that winning is contagious. Strong performers that help win games in the minors influence other players as they ascend the ladder. Getting this kind of exposure to winning suggests a confidence boost that assists in performance later on.
Our results also demonstrate the importance of a winning culture. This works in two ways–in management and in the clubhouse. Management needs to show the commitment to winning at the minor league level by filling roster spaces with objective talent to balance out highly touted prospects. And in the clubhouse, it’s important to emphasize these newfound mental or developmental benefits.
These results could also reveal how important environment is to performance and success–in any aspect of life. If baseball players have more success from being exposed to winning early on, how much of an effect can the right culture have on productivity in any field?
Future Research
There are at least three theories as to why our results show that winning has a significant effect in the upper levels of the minor leagues. The first revolves around the possibility of surplus talent. If a strong MLB team has too much talent on the fringes of its roster, those surplus players–who otherwise are capable of playing for an MLB team – would be pushed down to AAA. If the effect is large enough, it can even extend down to AA and so on. This would result in better prospects playing at levels they’re over-prepared for, thereby leading to elevated winning percentages.
The second possible theory to account for our findings would be that organizations that already prioritize winning in the minor leagues are more sabermetrically advanced than those that do not. These same organizations might also prioritize superior facilities and better nutrition, which improves the minor league lifestyle. In turn, their players may develop and succeed at higher rates in the first place.
Lastly, it’s possible that there are significant statistical influences on player promotions. Players who post better numbers in the upper levels of the minors likely stand a better chance of being promoted, even if they lack typically-valued tools.
With this in mind, we plan on attempting to tackle surplus theory, organizational effects, and statistical influence in the full academic version of this analysis.
Co-author CB Garrett
We would like to thank Syracuse University professors Nick Lyga and Dr. Rodney Paul for their guidance with this research

Comments are closed.