
Pitch-Framing Analysis Of 2018 High School Catchers


One of the most glaring weaknesses of the 2017 draft class was a lack of catching talent. With high schooler Luis Campusano-Bracero selected by the Padres with the 39th overall pick, it was the first draft since 2002 that a backstop wasn’t taken in the first round.
The catcher class of 2018 appears to be stronger, particularly among the high school ranks, though of course it’s still early in the process.
“Last year was pretty light,” said a scout with an American League club. “It was Campusano and M.J. Melendez . . . There weren’t as many to talk about at the top, and I feel like this year, just kind of top-to-bottom high school-wise, there are a lot of guys who can make big jumps in the spring like Campusano did . . .
“I feel like this class has a lot more guys who have a better chance to stay behind the plate, and (teams will) kind of hope the bat comes along, rather than in the reverse: ‘OK, he’s going to be able to hit, but is he going to stay (behind the plate)?’ “
Many of the top prep catchers for 2018 were at USA Baseball’s Tournament of Stars this year, and Baseball America was able to delve into the data to evaluate them defensively. Specifically, we examined which backstops managed to steal the most strikes for their pitchers. Data from the Tournament of Stars was provided by TrackMan under their new Developmental Partnership with USA Baseball, where TrackMan is their exclusive provider of ball-tracking solutions.
With an increased emphasis on pitch-framing by major league clubs—the gap between the best and worst framing catchers continues to shrink—and the proliferation of pitch-tracking data at the high school level, this type of analysis only seems natural.
Much attention is paid to high school catchers’ pop times on throws to second base, but scouts point to those pop times as overstated, especially in a showcase environment where players routinely cheat on their setup and hand positioning. Meanwhile, the biggest area of weakness for prep catchers tends to be receiving.
To determine the framing ability of TOS catchers, we first had to locate the strike zone in the data. For righthanded batters, the zone is shifted slightly to the left (from the pitcher’s perspective) to account for the number of pitches thrown away from the batter. The reverse is true for lefthanded batters.*
In this analysis, the distance from the edge of the zone is being used as a proxy for framing difficulty. Essentially, stealing a strike farther away from the zone should be more highly credited than one right off the edge. At the same time, getting robbed of a strike in the middle of the plate should ding the catcher more than if he were cheated out of a strike on the inside corner.
The table below lists the exact number of tracked pitches that each catcher received during the tournament. The “Stolen” and “Robbed” columns indicate how often the catcher either stole a strike out of the zone or was robbed of a strike inside the zone.
| Catcher | Pitches | In Zone | Out of Zone | Stolen | Robbed | Framing Rating |
| Will Banfield | 391 | 136 | 255 | 31 | 3 | .0270 |
| Carter Young | 131 | 56 | 75 | 9 | 2 | .0251 |
| Anthony Seigler | 214 | 57 | 157 | 18 | 2 | .0207 |
| Patrick Winkel | 217 | 79 | 138 | 15 | 3 | .0176 |
| Austin Wells | 471 | 178 | 293 | 35 | 14 | .0160 |
| Kameron Ojeda | 309 | 108 | 201 | 25 | 7 | .0157 |
| Henry Davis | 299 | 133 | 166 | 15 | 3 | .0157 |
| Adrian Del Castillo | 151 | 59 | 92 | 9 | 4 | .0149 |
The “Framing Rating” metric is the finalized statistic corresponding to each catcher. It measures both the frequency with which the catcher either “steals” a strike or is “robbed” of a strike, and the average distance away (in feet) from the closest point of a two-dimensional strike zone. This approximates the same way that catcher framing is measured in most contexts, which uses historical data to assign strike probabilities for every location.
Accordingly, Will Banfield rates as the best receiver at TOS because of how often he was able to steal strikes outside the zone and how far away those strikes are from the nearest point of the zone. That, combined with the minimal amount of robbed strikes, made the Vanderbilt commit stand out. During the week, he caught 391 pitches in total, and managed to steal 31 strikes outside the zone.
To get a visual understanding of this group’s receiving skills, check out the graphic below, which contains every tracked pitch thrown at TOS. Below that, we take a quick look at what stood out with each catcher (with his draft class listed in parentheses).
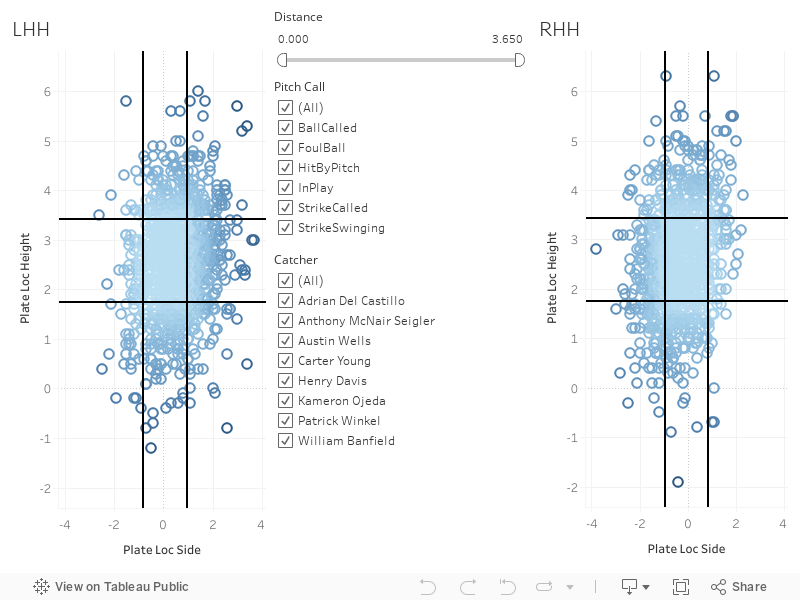
Will Banfield, C, Brookwood High, Snellville, Ga. (2018)

Banfield seems to have a knack for stealing strikes at the bottom of the zone. In the image above, his called strikes are highlighted in orange among every other called strike from the tournament.
What might help Banfield’s success rate on these low pitches is his advanced flexibility, and how easily he is able to fold up when receiving balls down in the zone.
“I think the only person I’ve seen since I’ve started scouting with as much flexibility as him is M.J. Melendez,” said the AL scout. “Melendez was characterized as one of the most athletic high school catchers in recent memory, and I think Banfield’s going to end up in that conversation just in terms of how (he and Melendez) move, how they get to their secondary positions, how they block laterally.”
Here’s 2018 GA C Will Banfield catching this morning for Team Elite Prime. #WP #MLBDraft pic.twitter.com/HLaQogcWCc
— Hudson Belinsky (@hudsonbelinsky) June 22, 2017
Banfield’s receiving skills are also more advanced thanks to catching elite arms such as fellow Georgia preps Kumar Rocker and Ethan Hankins since he was around 14.
Carter Young, C, Selah (Wash.) High (2019)
The sole 2019 catcher fared extremely well in this exercise, though it should be noted that his 131 total pitches are far and away the fewest of any other catcher in the group. Still, Young ranked second in framing rating, thanks in large part to the highest average steal distance of the group at .384 feet, with the third-best frequency of stolen strikes.
Anthony Seigler, C, Cartersville (Ga.) High (2018)

Seigler’s chart shows very few balls called in the strike zone because the Auburn commit was robbed just twice on 57 pitches in the zone, good for a 3.5 rob percentage—the third-lowest of the group.
One of the balls called in the zone was a borderline pitch, and while the second was clearly a strike it is still much closer to the edge of the strike zone than a number of Wells’ pitches. We’ll get to Wells soon.
Seigler’s framing data backs up the industry’s opinion of him behind the plate at this point.
“He might be one of the better raw receivers that I saw,” said the AL scout. “His hands are (some) of the better ones in the class. Everything is really soft in the mitt, he doesn’t move a whole lot, sticks it pretty well, presents it very well. I can’t see him costing many catchers strikes.”
Patrick Winkel, C, Amity Regional High, Woodbridge, Conn. (2018)
Winkel was solid across the board during TOS, ranking sixth in steal frequency, fifth in average steal distance, third in framing frequency and fourth in framing rating—which, again, factors in the distance of steals and robs. With a handful of middling ratings across the board, Winkel provided a stable presence behind the dish.
If you toggle through Winkel’s balls called you will see just one pitch that is clearly within the strike zone.
Austin Wells, C, Bishop Gorman High, Las Vegas (2018)

Wells might have been the unluckiest player of the group. The Stanford commit had far and away the most balls called inside the strike zone, with 14. The next closest was Ojeda with seven. While Wells did have the highest number of total pitches tracked in the zone (178), his rob percentage of 7.9 percent was also the highest mark.
His catching chart above shows a number of pitches that don’t appear to be close to the edges of the zone at all.
While Wells seems to have cost his pitchers strikes at the bottom of the zone, he also stole more pitches above the zone than any of the other catchers in the group, essentially shifting his called zone higher. Wells is the tallest catcher of the group at 6-foot-3 (the other seven are between 5-foot-11 and 6-foot-1) which lends credence to claims that taller catchers frame better at the top of the zone.
Kameron Ojeda, C, St. John Bosco High, Bellflower, Calif. (2018)
Ojeda did a particularly good job stealing strikes on the outside corners—against both righthanded and lefthanded batters—and had the highest steal frequency of the group. But, as mentioned above, his stolen strikes were closer to the zone than any other player (.242 feet on average).
“(Ojeda) has an absolute bazooka for a right arm,” said the AL scout. “You see a lot of kids, they’re focused way more on throwing the ball around. Ojeda might be a small victim of this because he enjoys throwing so much. I mean he loves to throw, just from watching. He loves to show it off. And that’s totally fine. But I think he costs himself receiving wise because of it.”
Henry Davis, C, Fox Lane High, Bedford, N.Y. (2018)
While Davis ranked near the bottom of the group in terms of framing rating, he did have the third-highest steal distance with each stolen strike 0.356 feet away from the zone, on average. He managed to get one called strike against a lefthanded batter that was 0.942 feet off the outside corner—the second farthest such pitch stolen.
Davis also stands at the top of the group in a non-framing area:
“In terms of actual arm strength, Banfield and Henry Davis are probably in their own category,” said the AL scout.
Adrian Del Castillo, C, Gulliver Prep, Miami (2018)
Del Castillo ranked at the bottom of the group in terms of both framing frequency and framing rating. After Wells, he was robbed most frequently on pitches inside the strike zone, though the average rob distance on these pitches was the lowest of any of the other catchers. This indicates that there were a number of fringy calls on borderline pitches that didn’t go in his favor.
Del Castillo is thought of more as an offensive catcher, with power from the left side, and while he didn’t fare well in the pitch-framing metrics, he shined with a bat in his hand, recording the eighth-best average exit velocity (90.2 mph) at TOS and the sixth-hardest-hit ball of the event at 105.6 mph.
While none of the data above is absolutely conclusive about any of these catchers’ pitch-framing ability—things get noisy fast in a four-game sample, and catchers worked with different combinations of pitchers and umpires—it does provide some useful data points, and in several instances the numbers back up opinions of the scouting community.
* Micah Daley-Harris, the director of analytics for University of North Carolina baseball, assisted in determining strike zone dimensions.

Comments are closed.